


Promptmonitor: AI visibility dashboard
The problem
Search is moving into AI answers. When someone asks ChatGPT for the “best cartoon channel for kids”, the brands it names, and the order it names them in, shape the decision before a website is ever visited. Promptmonitor runs a brand’s real prompts across the major AI models every week and turns those answers into visibility, sentiment and competitor data.
The data was there, but the product didn’t help teams act on it:
- Scores without context. A visibility number gave no sense of who a brand was losing to.
- Competitors lived on separate pages, so there was no like-for-like comparison on the homepage.
- No signal for where in an answer a brand appears, even though being named first matters most.
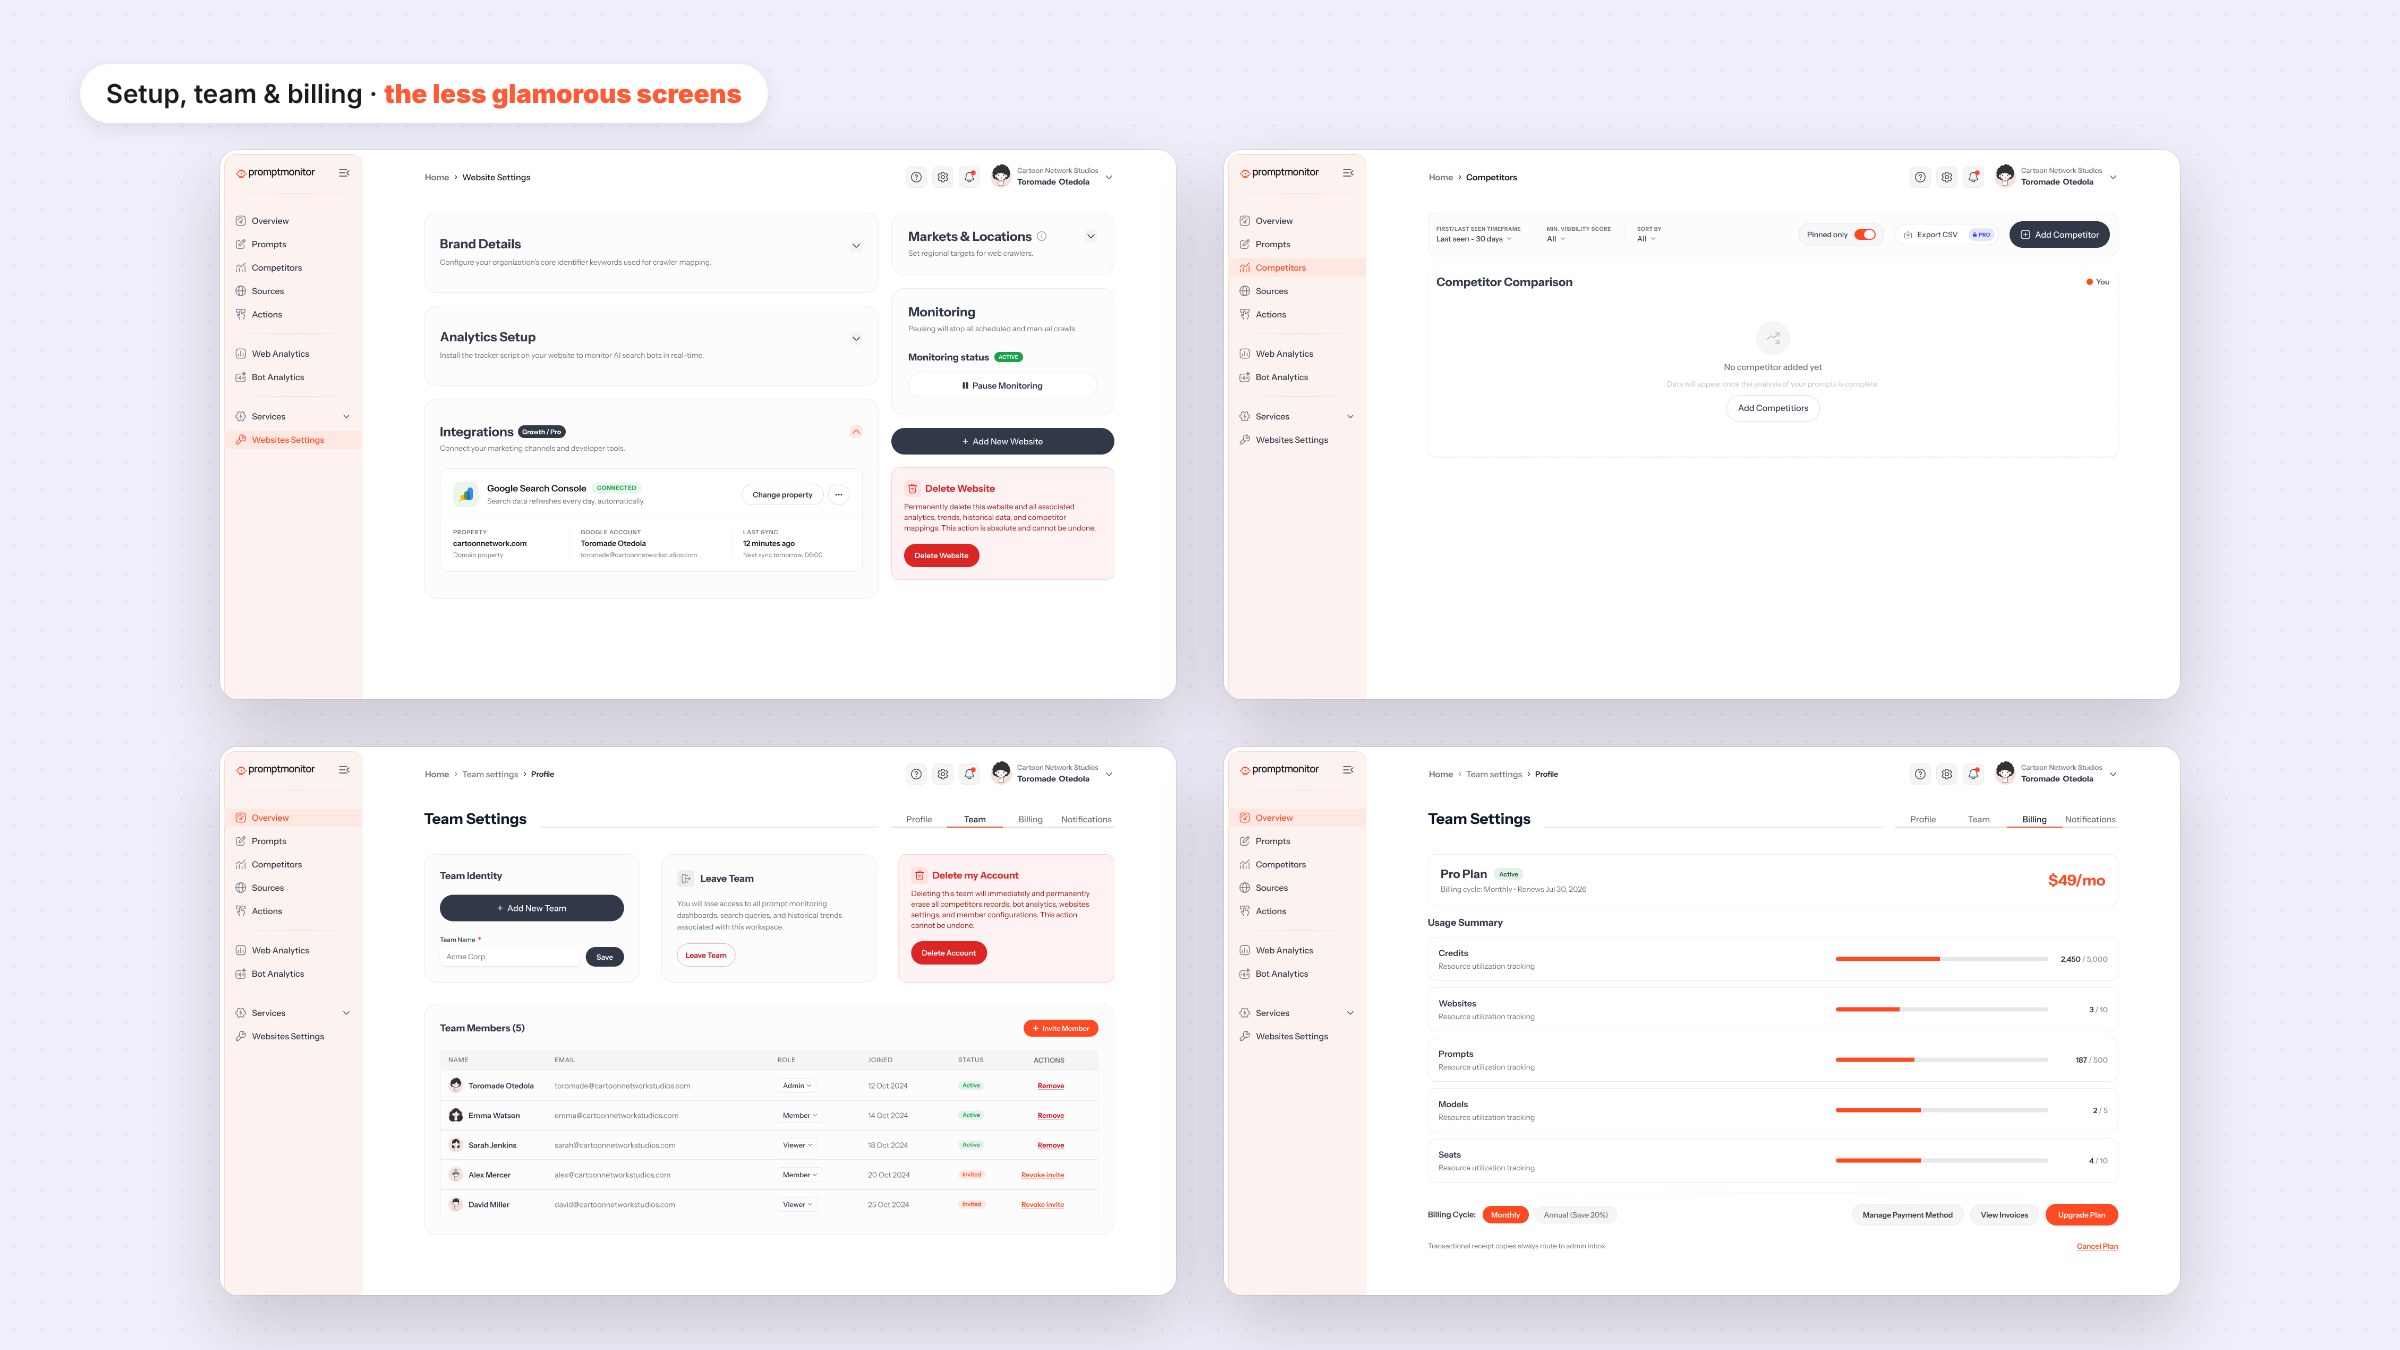
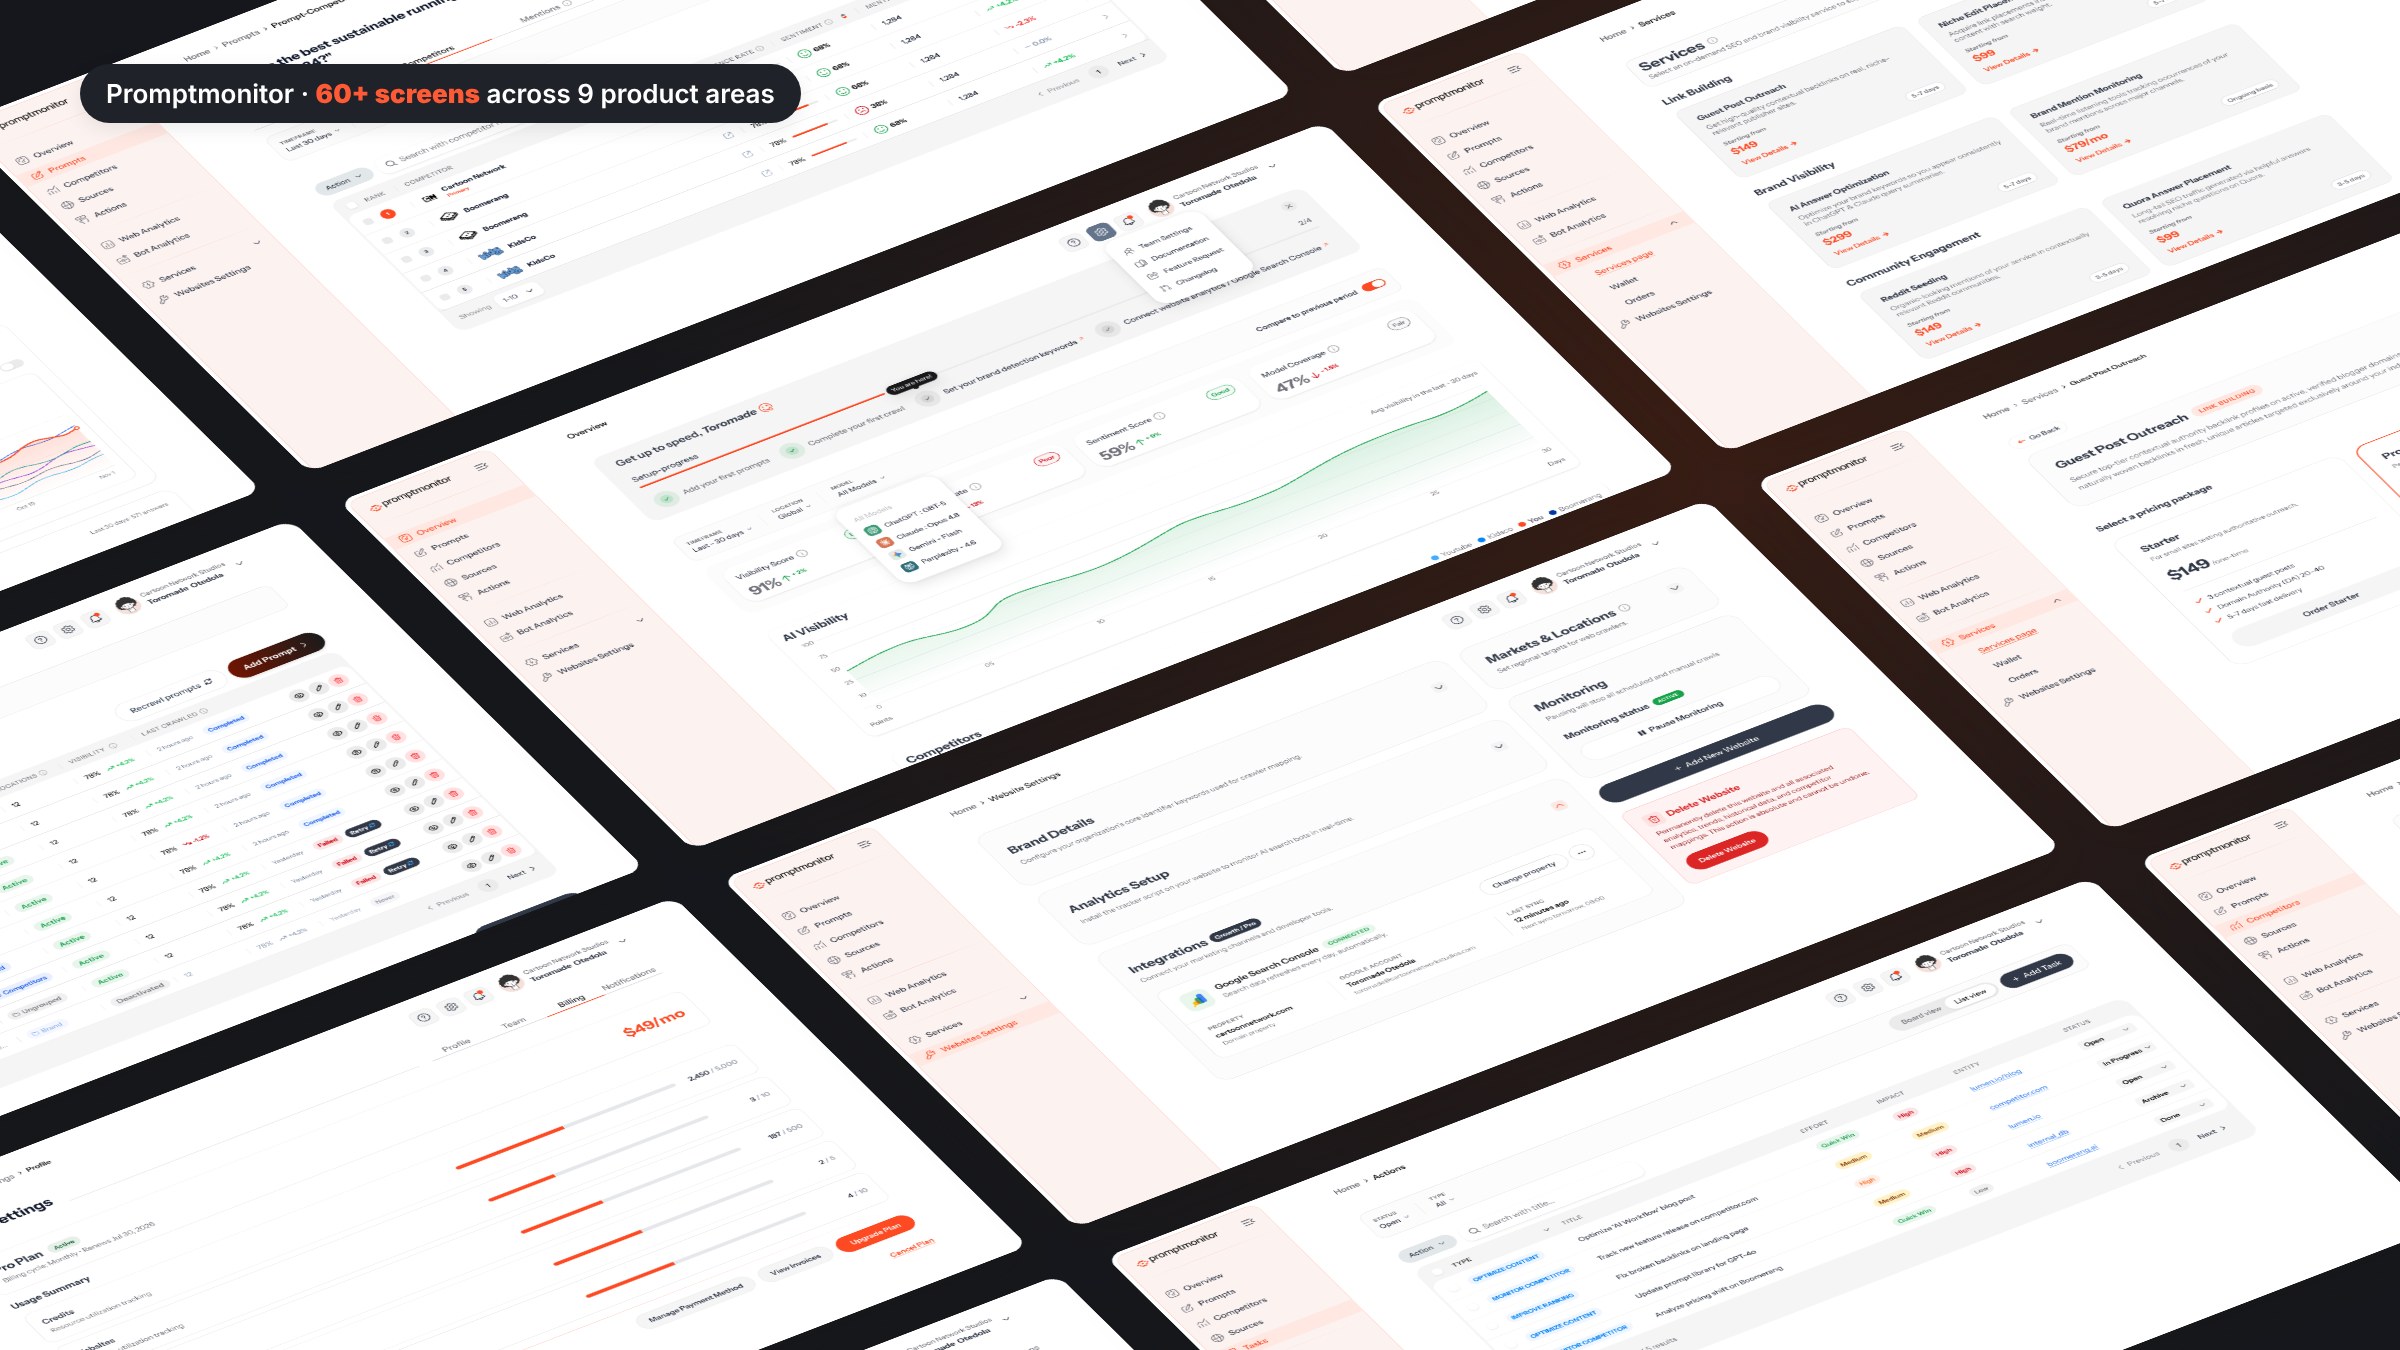
- Dozens of screens built at different times, with drifting components and patterns.
Project goal
- Make the Overview answer one question in seconds: how am I doing against the competitors I care about?
- Introduce answer position as a first-class metric, explained in plain language.
- Connect owned search data (Google Search Console) to AI visibility.
- Ship everything on one consistent design system engineering can build from.
Research and key features
Product and data audit
- Mapped every metric the crawler produces against the questions marketing teams actually ask.
- Found key numbers repeated across pages with different labels and definitions.
- Found empty, error and limit states missing or inconsistent.
Reviewing the category
Looked at how SEO and analytics tools present competitive data. The patterns that worked: a clear “you” versus “them” comparison, filters that change the whole page, and metrics explained in context rather than in docs.
Key features designed
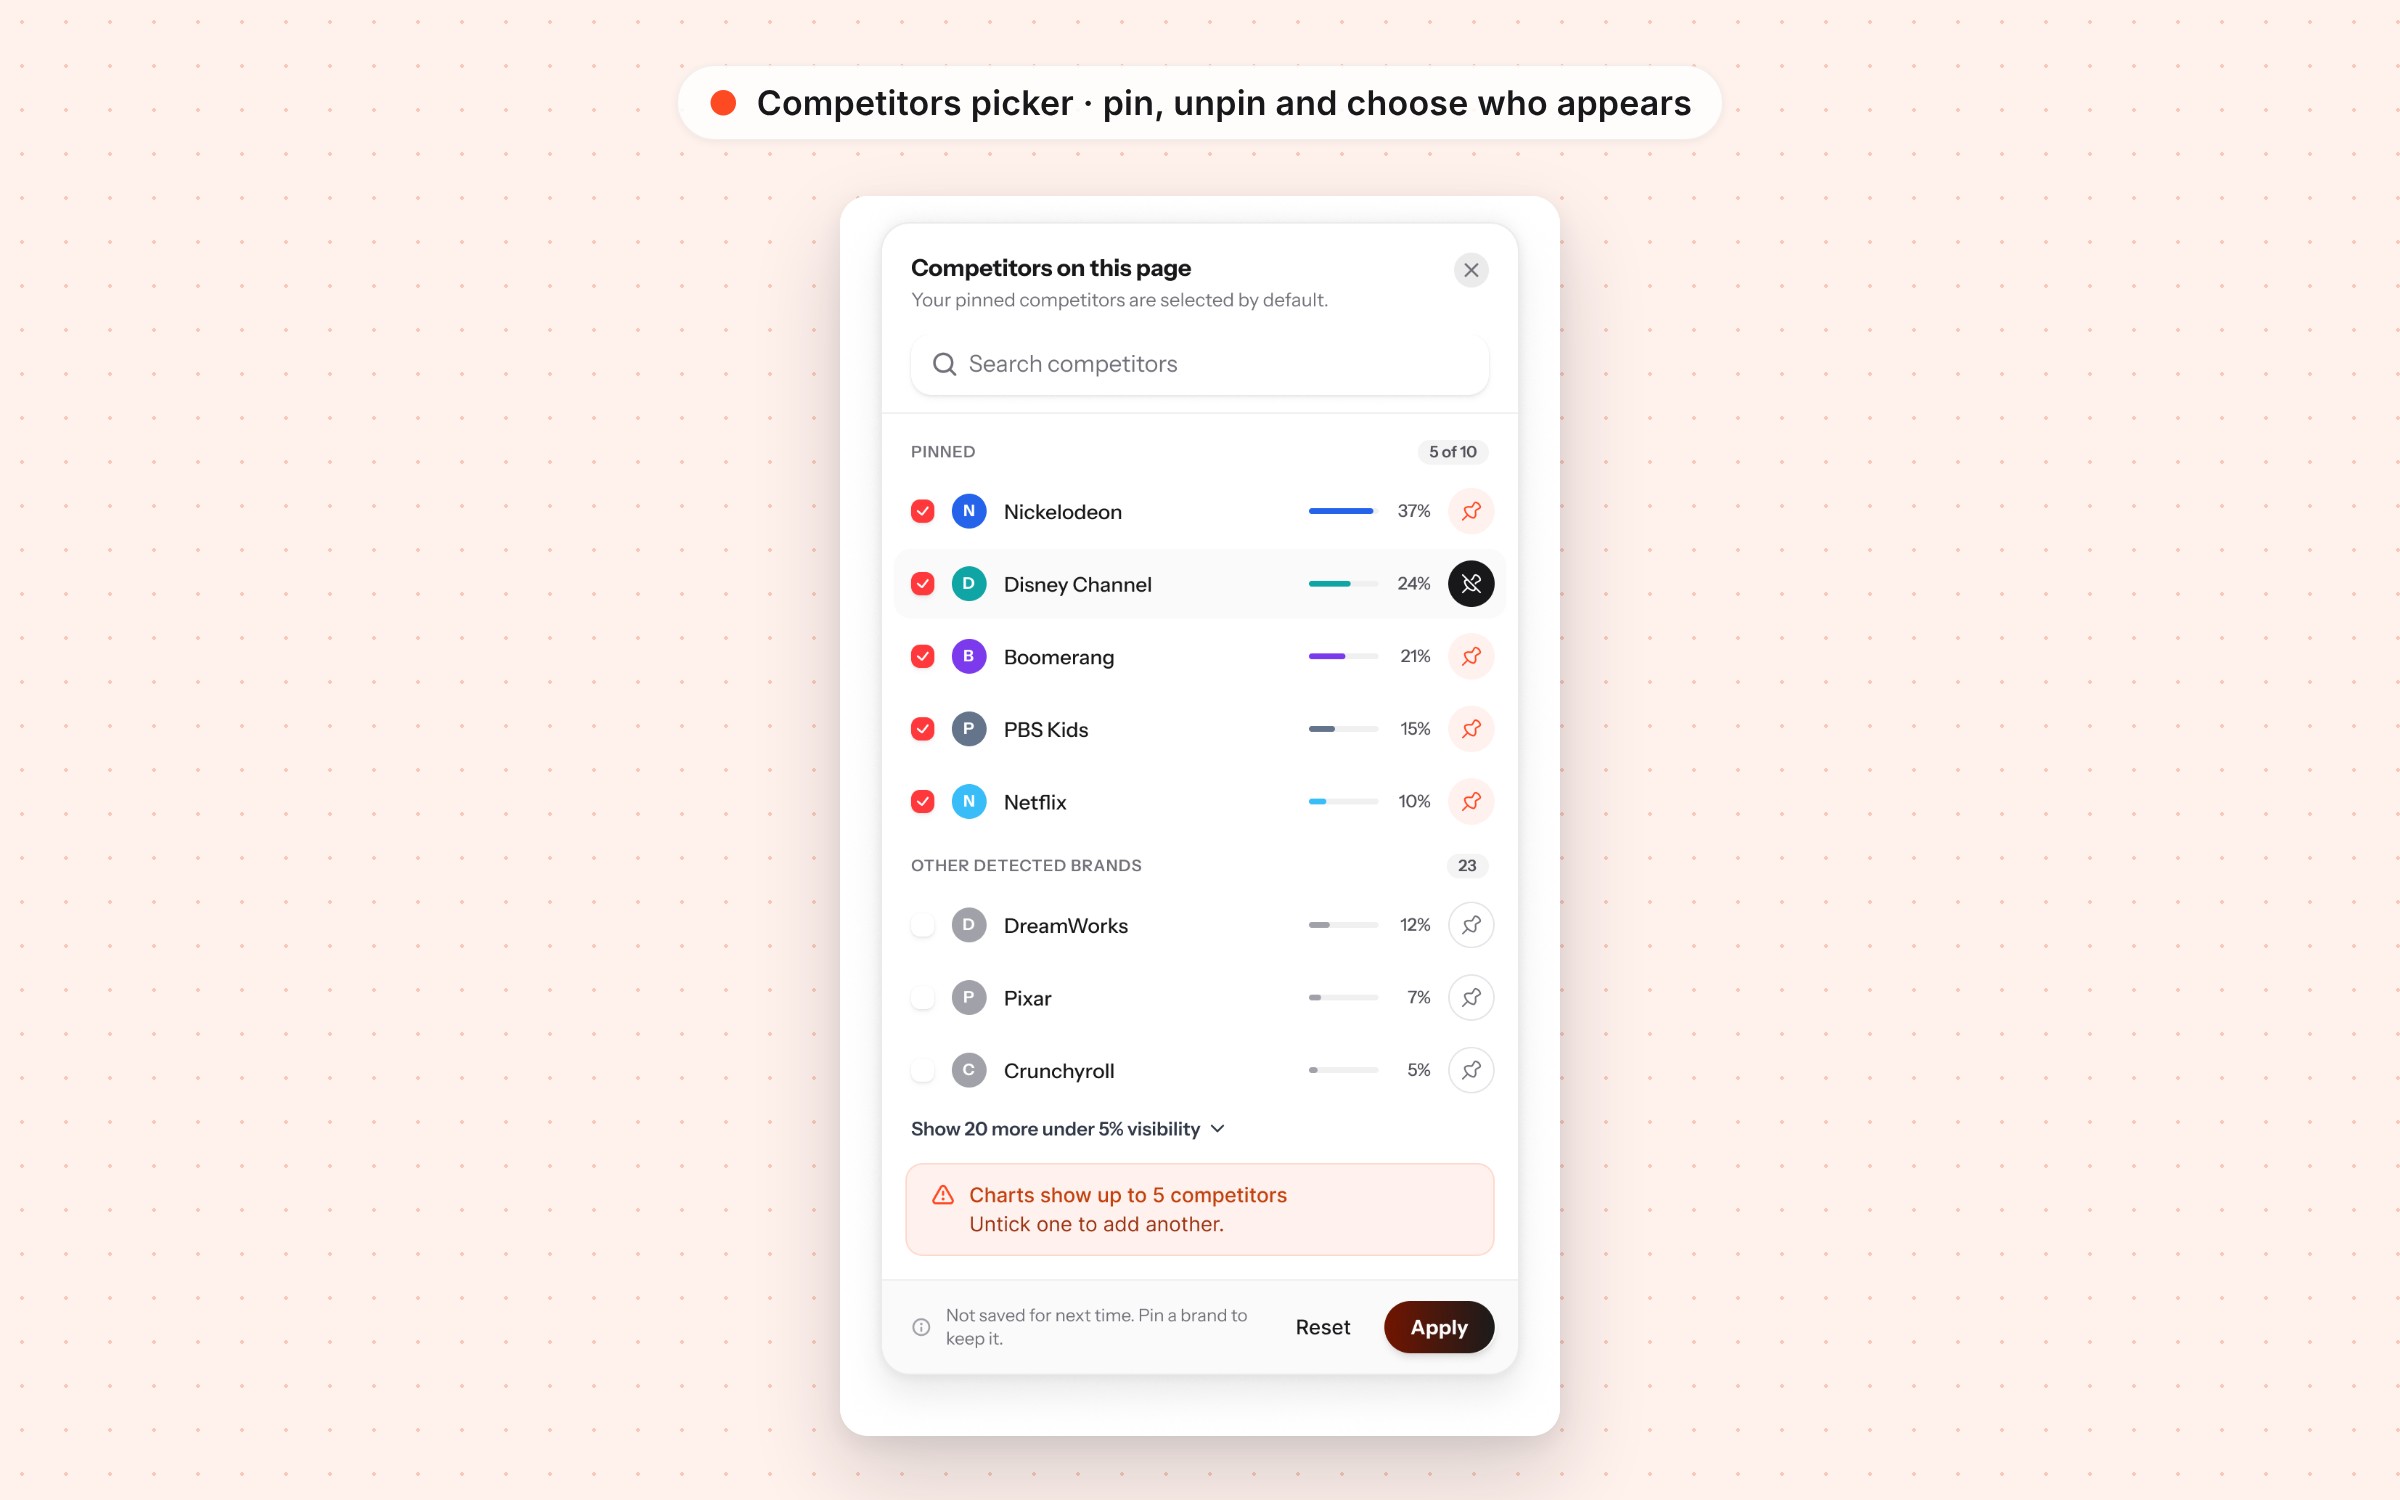
Pinned competitors
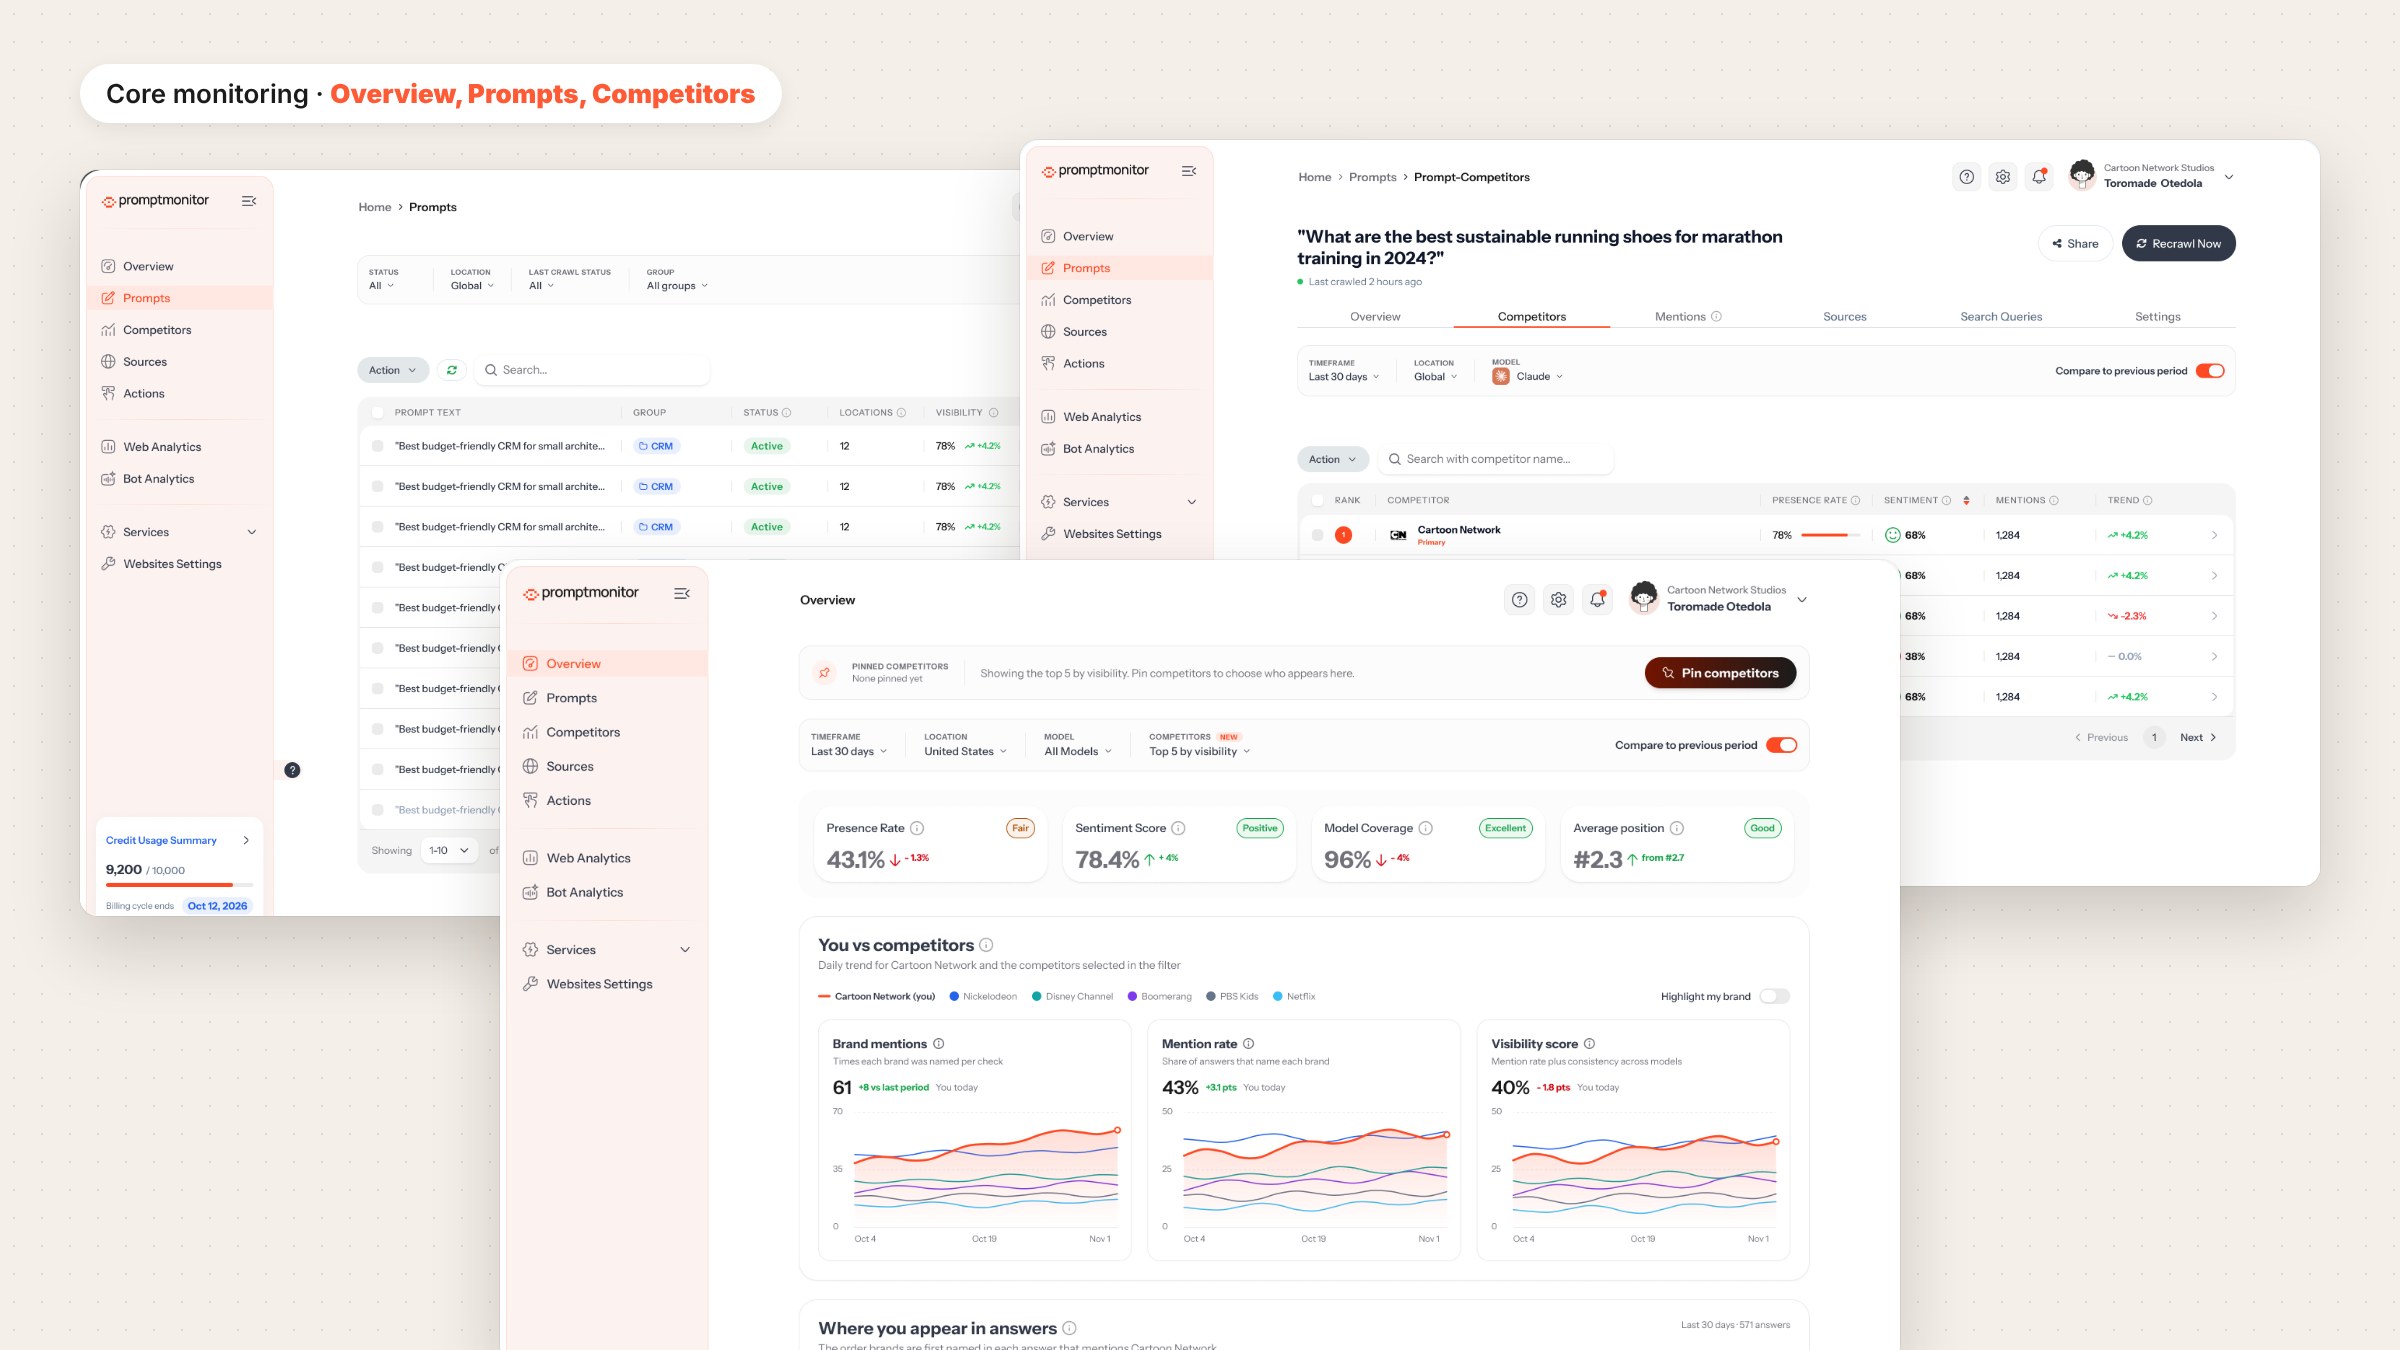
- Pin up to 10 competitors once; they appear in a strip at the top of the homepage.
- A Competitors filter defaults to pinned brands, shows a count, and updates the whole page.
- Ad-hoc selections aren’t saved. Pinning is the deliberate way to keep a brand.
- With no pins, the page falls back to the top 5 by visibility and invites you to pin.
Comparison charts and “Highlight my brand”
- Your brand draws as a bold line and each competitor as a thinner one, capped at 5 so charts stay readable.
- One switch softens every competitor across the page: line charts, share of voice and citations.
Average position
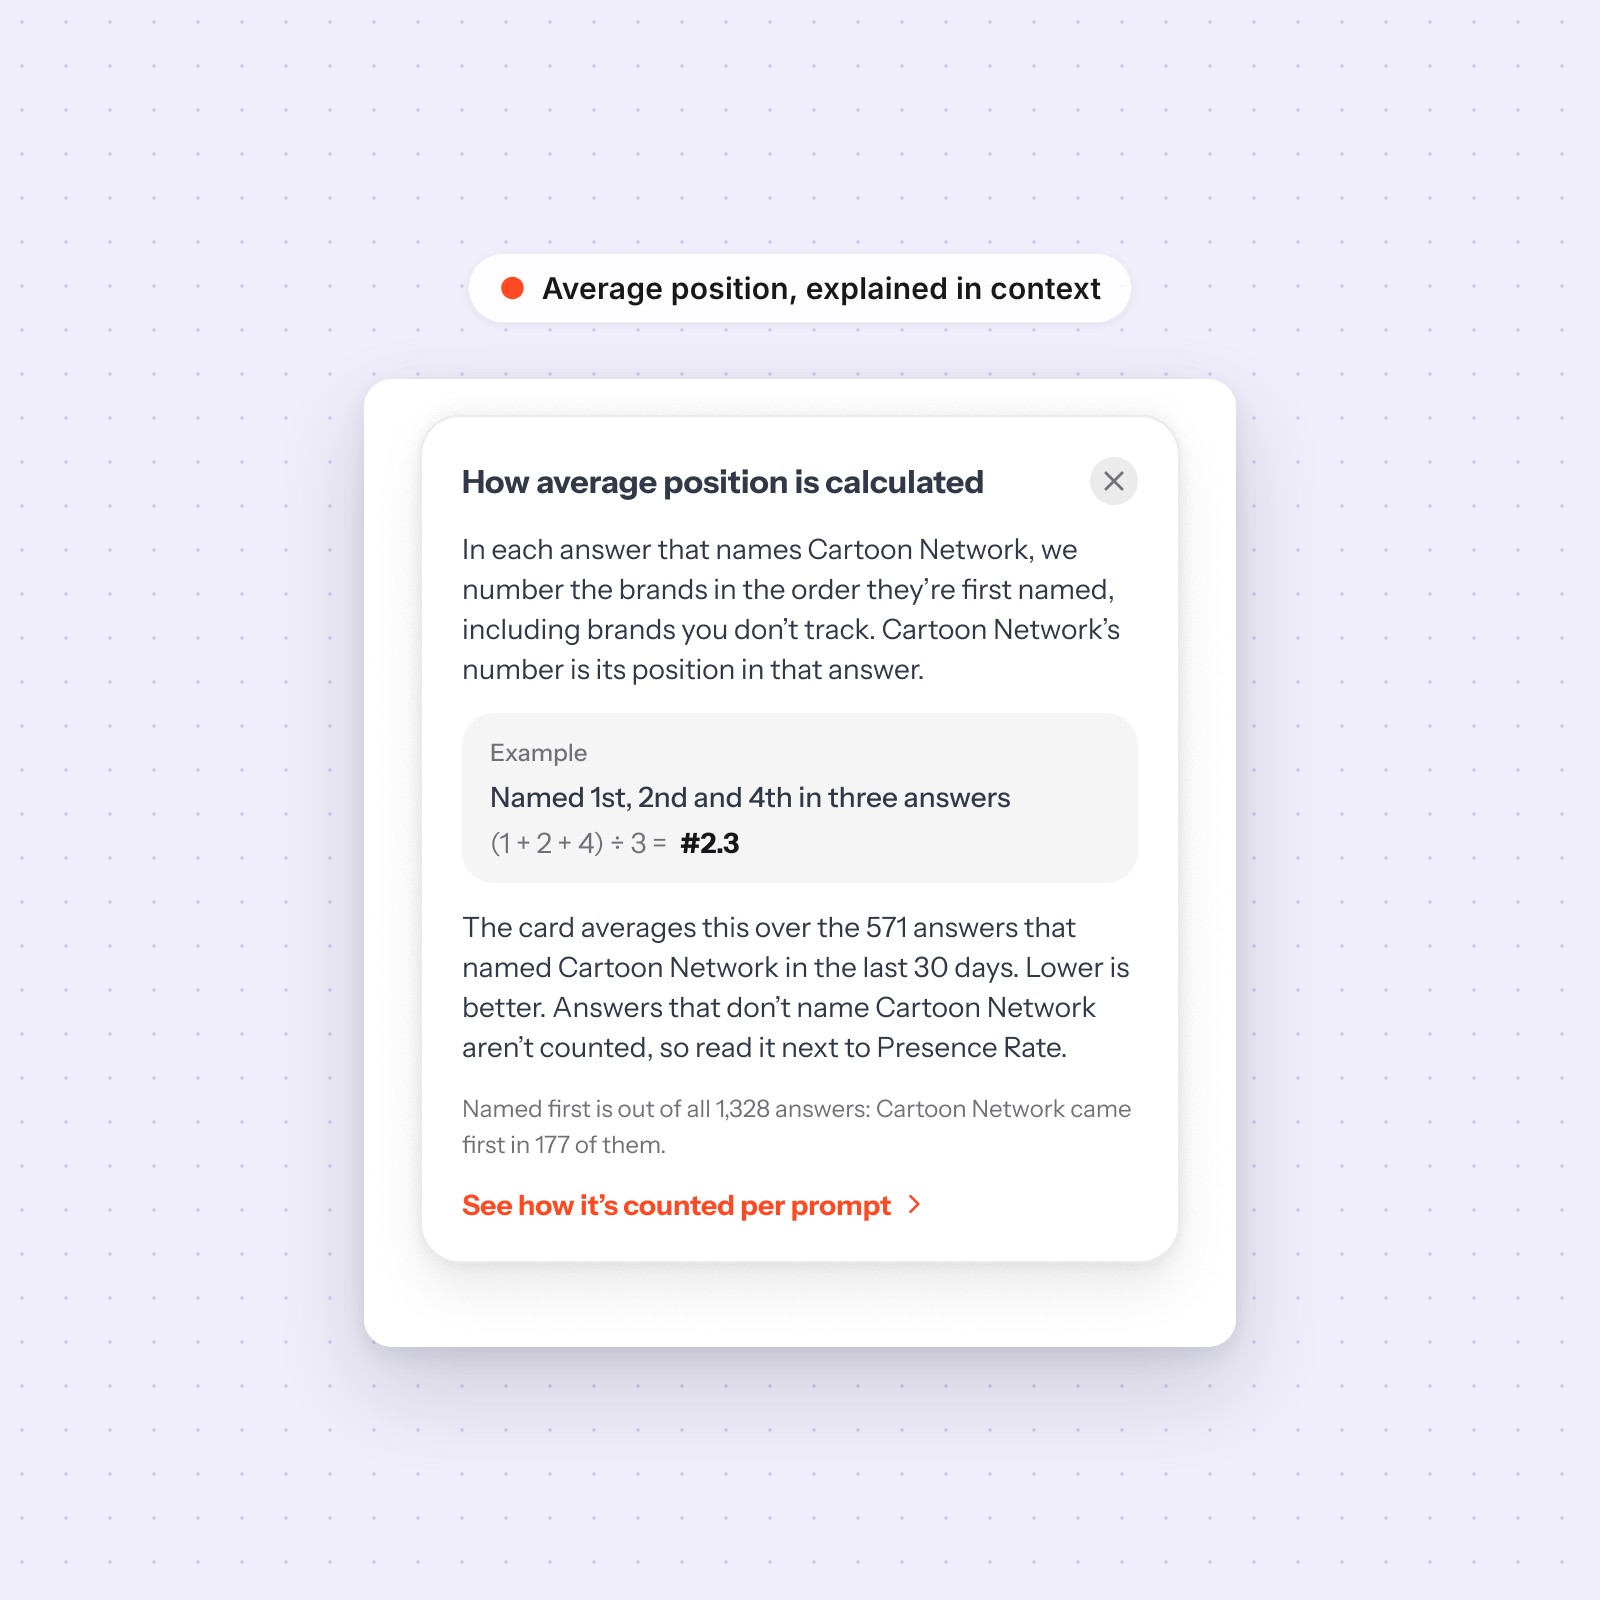
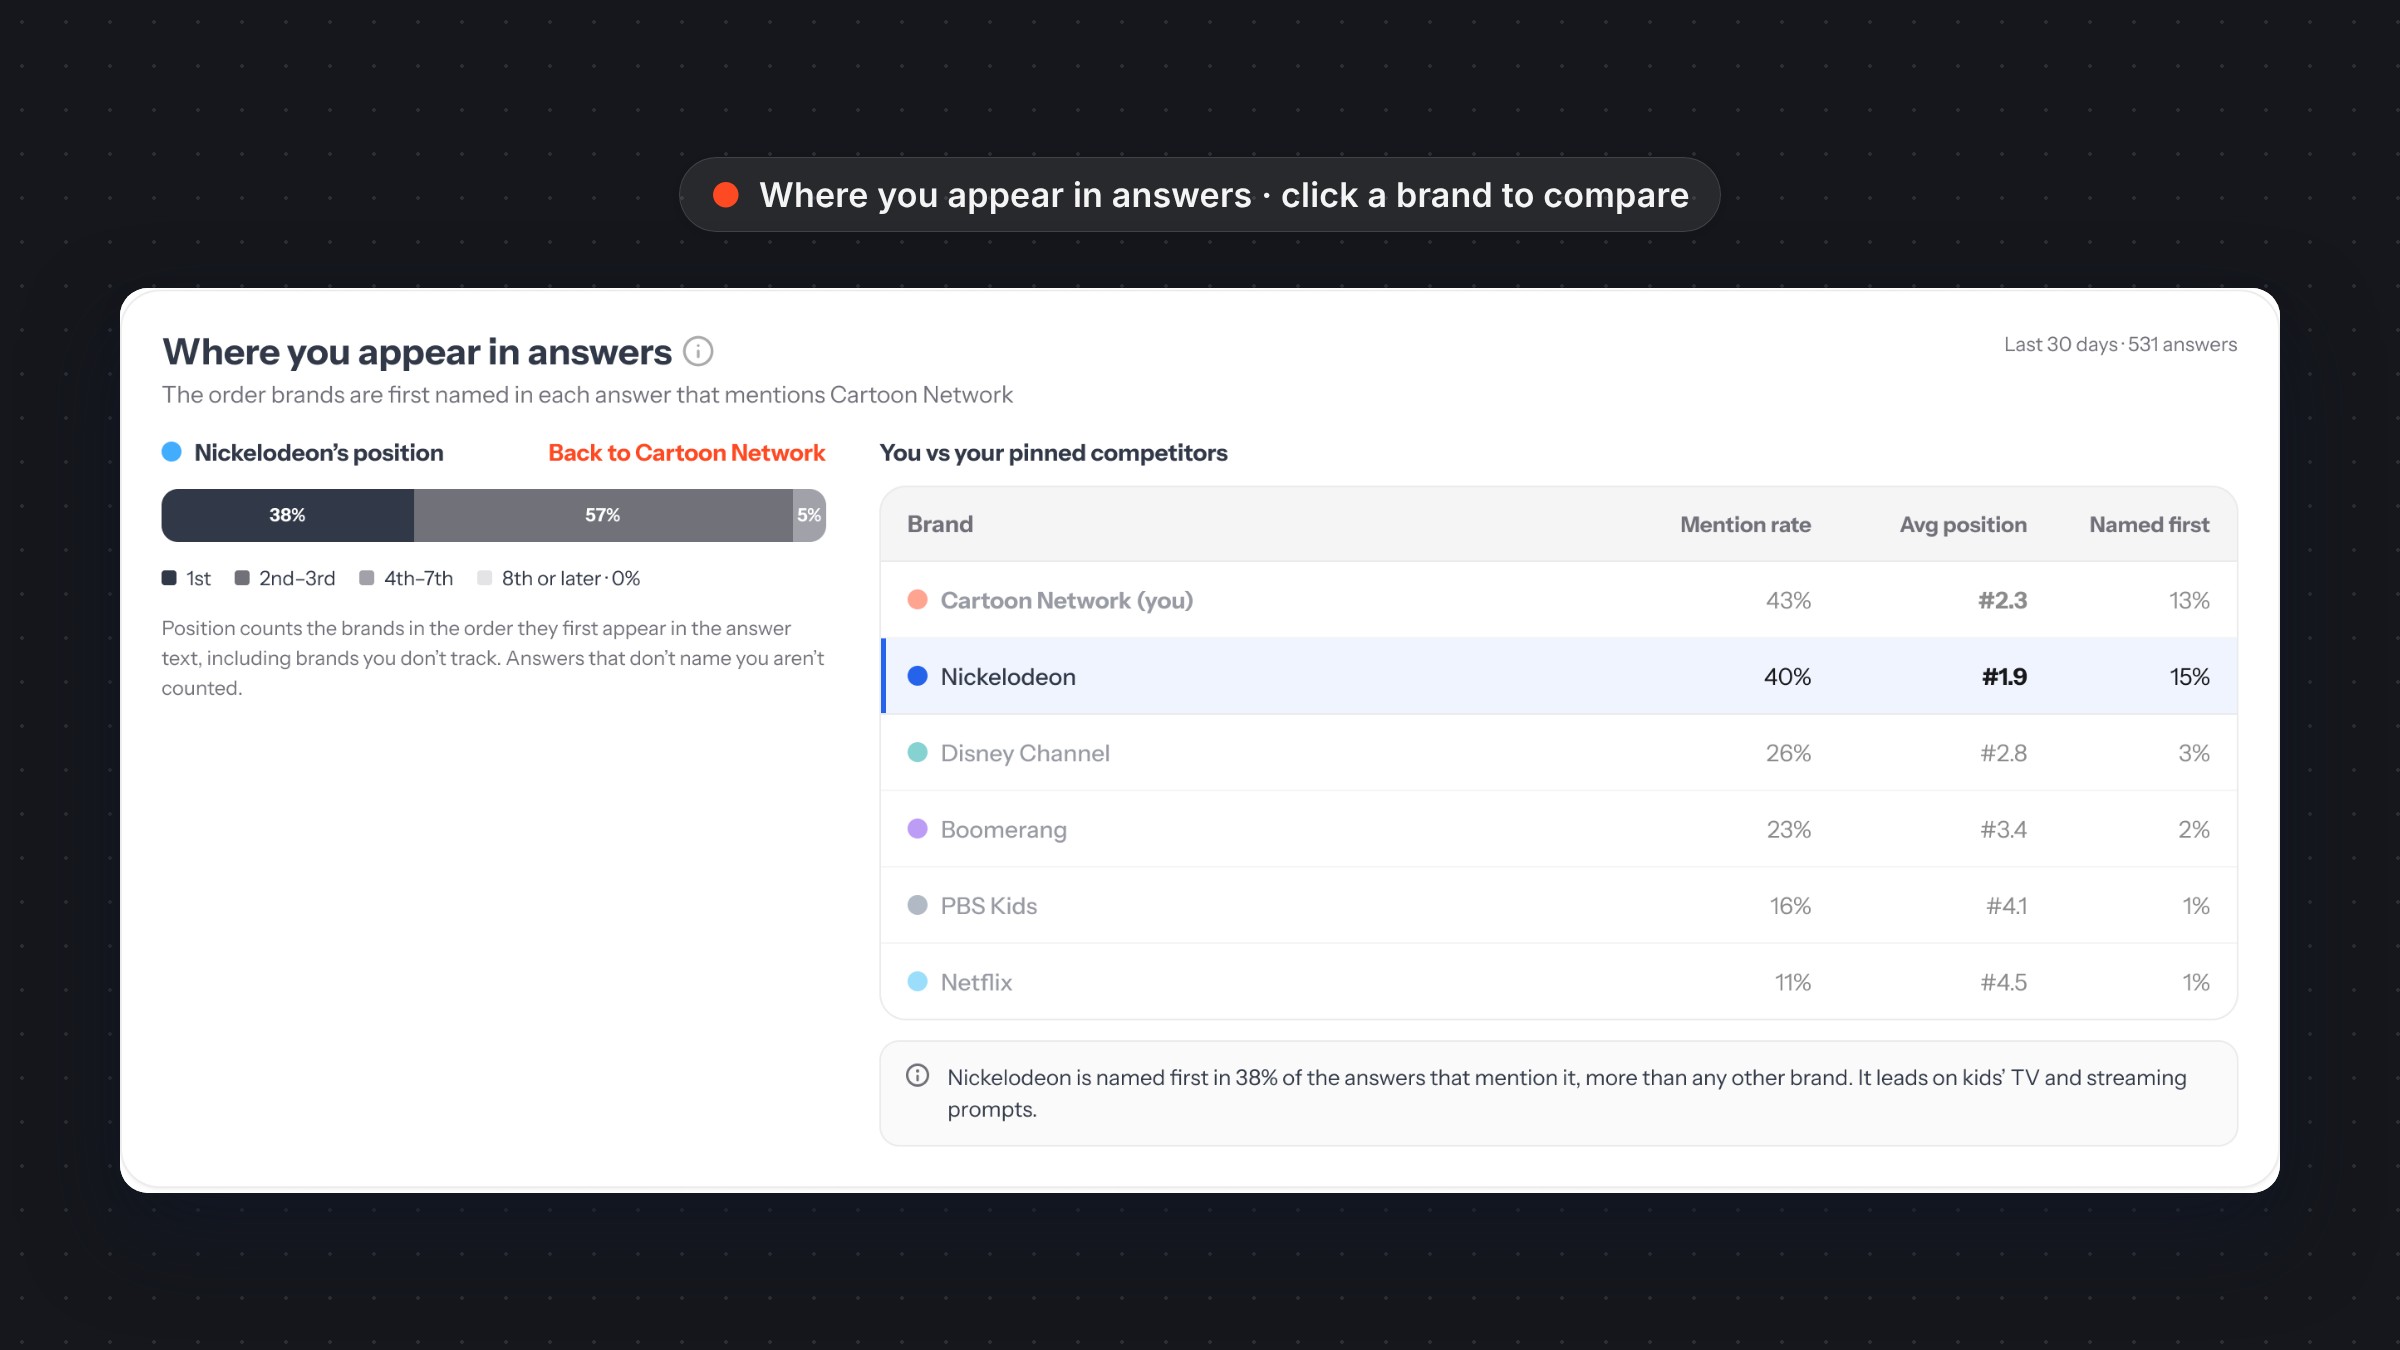
- A new KPI: the order in which a brand is first named in each answer, averaged. Lower is better.
- “Where you appear in answers” breaks it into named 1st, 2nd–3rd, 4th–7th and 8th or later, next to a table of pinned competitors.
- An in-product explainer walks through the maths with a worked example.
Share of voice and citations
- A donut and ranked list show your share against chosen competitors, with everyone else grouped under an expandable “Others”.
- Citations compare how often AI answers cite your site versus competitors’ sites.
Prompts with position
- Each prompt shows average position, who’s usually named first, and change versus last month.
- Expanding a prompt shows a real answer with every brand numbered in the order it was named.
Google Search Console connection
- A full connect flow across 16 states, from authorising and picking a property to syncing, lost access and disconnecting.

Approach
1. Start from the decision, not the data
Every section was framed around a question a marketer asks: Am I visible? Against whom? Where in the answer? What changed? Metrics that didn’t answer one of these moved off the homepage.
2. Design every state
- Empty: no pins yet, no data, first sync.
- Limits: 10 pins and 5 competitors on charts, with the reason stated in the UI.
- Errors: lost Search Console access, a closed authorisation window, no matching property.
- Edge cases: a brand that’s never named shows “Not named” rather than a misleading zero.
3. Explain the maths where it’s used
New metrics come with short, plain-language explanations in tooltips and footnotes, for example why average position should be read next to presence rate, and why shares don’t change when you pin or unpin.
4. One system, applied everywhere
- Built on the existing Promptmonitor design system: Instrument Sans, shared tokens, cards, tables, chips, alerts and dropdowns.
- A data palette that reserves the brand’s orange for “you” and uses a cool, evenly spaced set for competitors, so your brand always stands out.
- Reused existing components before creating new ones, and documented new patterns alongside the screens.
Outcome
The Overview now answers “are we winning in AI answers, and against whom?” on one screen, with position, share of voice and citations all following the same competitor selection. Every state is designed and documented in the system, ready for engineering.